Of course, I'm reminded that we're not SO far north. I have a few friends in Vancouver, BC, who have a more extreme situation. But that's Canada. It's not called the Great White NORTH for nothing (btw, I'm an old SCTV fan).
But wait, are Canadians really "northerners" compared to us? I mean, I sometimes hear the statistic that 90% of the Canadian population lives within 100 miles of the US border. Because they love us. Or because being really far north isn't very fun. Here's a source: https://www.cia.gov/library/publications/the-world-factbook/geos/ca.html
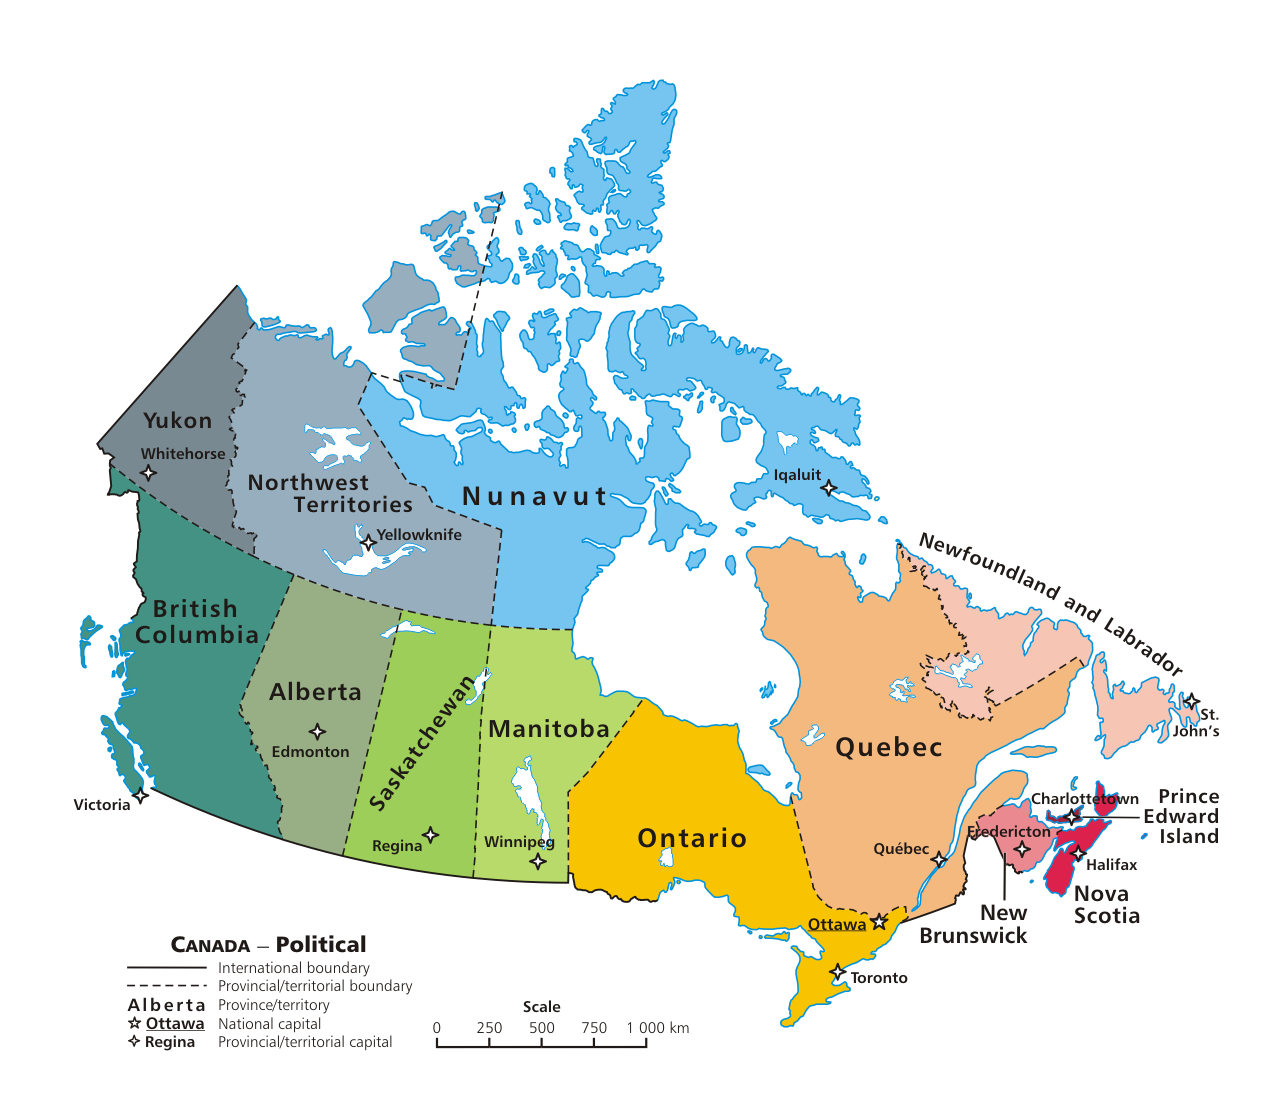
And another thing - if you take a good look at a map (preferably a globe), you'll see that a large portion of Eastern Canada isn't that far north at all. The border takes a big southern dip in the map just east of the Great Lakes that doesn't come back north til the edge of Maine. That big dip, whatever Canadians call it, seems to hold a large portion of Canada's major cities (Toronto, Ottawa, Montreal, Quebec City...).

It seemed likely to me that most of the population of Canada lived in that dip, which would incidate that most of the population of Canada actually lives farther south than Seattle!
Note: On most maps, because of that whole sphericalish nature of Earth, lots of parts of Canada that are south of Seattle actually appear to easily be north of Seattle. If you look at this map from Wikimedia, it looks like St. John's, way on the east coast of Canada, easily looks to be north of Seattle. It isn't. At latitude 47.5675°N, it is south of Seattle (47.6097°N). Quebec, at 46.816667°N, is also south of Seattle.
Anyway, I wanted to know how many Canadians live south of Seattle.
So I set out to answer that question, programmatically.
My first thought was to find some Canadian census data. I quickly found an official looking site from the 2011 census (http://www12.statcan.gc.ca/census-recensement/2011/dp-pd/hlt-fst/pd-pl/Table-Tableau.cfm?LANG=Eng&T=801&S=51&O=A), and zeroed in on a large list of Canadian population centers with populations of at least 1000 people. I figured I could take these centers, find their locations, compare them to Seattle, and have my answer! People living outside of those areas would probably be an insignificant portion of the population (MISTAKE! My big city biases bit me there).
This solution was a little more interesting than my final solution, so I'll briefly describe it here:
Given the spreadsheet of all population centers
Go through the spreadsheet, feed the population center name into website (www.findlatitudeandlongitude.com), extract the lat/lon of that population center.
(missing population centers needed to be researched manually)
As I mentioned earlier, my big city biases bit me there. I thought, how much of the population actually lived outside of population centers of 1000 people? Well, of the 33+ million Canadians, around 10 million of them. Oops. That seemed like too large a part of the population to not account for in my solution, so I went back to the drawing board.
How about taking all of the county populations? Unlike the United States, Canada doesn't have counties everywhere, at least not calling them 'counties'. So that thought was a no go.
Then I discovered that Canada does have "census districts". 200+ of them, and they cover the entire country, and the sum of the populations of all of them was the total population of Canada! Yay! So I had all of the population data I needed, and just needed their locations, so I could compare the latitude with Seattle.
The easiest answer came from Wikipedia's List_of_census_divisions_of_Canada_by_population. Each census division was listed (their source was the same 2011 Canadian census source I was using), but in addition to the data from the census, was a column listing a demonstrative Canadian population center, including a link that typically included the lat/lon of that population center. So it ended up being more of a generic Wikipedia scraping project than a web scraping project. A little less diverse, but it would give me the answer. And, Wikipedia can be somewhat standardized, so I was generally able to find the lat/lon programmatically (with a small number of exceptions which I handled manually).
So the code is in Python, and I got most of my information from Wikipedia (Google searched when I needed more info).
I realize that here's a margin for error regaring lat/lon. My program is treating the entire population of a census district (or Seattle) as residing in the exact lat/lon point found. I didn't think this was too much of a problem, especially when I took a manual look at the populations roughly around the same latitude as Seattle, which accounted for only a few hundred thousand Canadians who might incorrectly be counted as south of Seattle when they are north, or vice versa. Like the people of Grates Cove, NL (latitude 48.1619°N), counted as being south of Seattle (47.6097°N) because they are in Canadian Census Division Newfoundland Division 1, which is listed in Wikipedia as being at 47.55°N. I just wanted an estimate, so this is good enough. If we pick a location latitudinally closer to Canadian population centers, the estimate will be worse.
How I Did It
My code can be found on GitHub: https://github.com/EdwardTonai/public/blob/master/python/PopulationLocation/CanadianPopulation.py
First, I tried Webdriver. In my first iteration of this problem, I'd tried to use a website, findlatitudeandlongitude.com, to get the lat/lon coordinates of the population centers I was considering. This required inputting the name of the city into the form, submitting the info, and then retrieving the lat/lon. That was mostly fine. Occasionally I couldn't find a population center there, so I'd have to find it elsewhere, but that was the only problem.
When I discovered that using population centers missed 10 million of Canada's 33+ million people, I found the Census Districts, and that led me to Wikipedia. There, most of the Census District pages included a lat/lon, and I decided that was representative enough for my estimation needs.
I no longer needed to manipulate forms, so I switched to mechanize and BeautifulSoup.
Mechanize gives you a browser-like object to use to interact with web pages.
I opened up the Canada Census Division page on Wikipedia, and put it through BeautifulSoup, which allowed me to more easily parse through the data.
Once I grabbed the table, I quickly went through each row, extracting the information I needed from each Census Division - name, population, and location.
You might notice that I encoded the name into a utf-8. This is because when I first wrote the data to a .csv file (you'll see this a few lines down), it complained about ansi not being able to handle Canadian city names like Thérèse-De Blainville. After doing a little research, including reading Joel's Article on Unicode, I decided to just force it to utf-8 for simplicity. I only sorta cared about each city's name.
Going back to getting location, it was a little more involved because that data wasn't in the table. In the table, each division's name had a link to that division's own Wikipedia page. Often, those pages had a lat/long for that division.
Going back to getting location, it was a little more involved because that data wasn't in the table. In the table, each division's name had a link to that division's own Wikipedia page. Often, those pages had a lat/long for that division.
When it didn't, I had to go back to the main page's table and look at the column for the Illustrative census subdivision, and look at that page for a lat/long. That was successful, except for Quebec City, which is a weird kind of census division for some reason. I ended up getting the lat/long for that manually.
Once I retrieved a census division's data, I stuck it in a list. And I put that list in a list of lists that represented all off the census division. That, I output to a csv file.
And that was the end of my webwork. To calculate what percentage of Canada's population lives south of Seattle, I took Seattle's latitude (47.6097°N), and ran it against the latitudes in my csv file, tallying the populations of divisions greater than and less than my latitude.
My answer? 64.18% of Canada's population (21,486,482 people) live south of Seattle, according to the 2011 census. Take that, my southerner friends (most of you Canadians).
To borrow a phrase from Game of Thrones (from the show - I don't think the quote is in the book), you're from south of the 47.6th parallel, that makes you a southerner to me.
How Others Compare
Here are a few other cities' results when I ran them through my program. The closer the city is latitudinally to large Canadian population centers, the less accurate the calculation will be (I'm looking at the Vancouver and Detroit estimates, in particular).| City | Latitude | % of Canadians Living Farther South |
|---|---|---|
| Juneau, AL | 58.3000°N | 99.66% |
| (just north of) Vancouver, BC | 49.24945°N | 76.01% |
| Blaine, WA (at the Canada border) | 48.9881°N | 68.71% |
| Everett, WA | 47.9633°N | 64.82% |
| Seattle, WA | 47.6097°N | 64.18% |
| Madawaska, ME (Northern Maine) | 47.207186°N | 62.89% |
| Fargo, ND | 46.8772°N | 62.17% |
| Portland, OR | 45.5200°N | 47.81% |
| Minneapolis, MN | 44.9778°N | 33.78% |
| Augusta, ME | 44.3235°N | 28.63% |
| Portland, ME | 43.6667°N | 14.42% |
| Detroit, MI | 42.3314°N | 1.16% |
| Chicago, IL | 41.8369°N | 0.00% |
Sorry, 171 residents of Pelee Island. I know you're south of Chicago, but your census district representative location isn't!
The north remembers!
ReplyDeleteThis comment has been removed by a blog administrator.
ReplyDeleteYou might be the first American in history to realize this. :)
ReplyDeleteHell you might be the first American in history to study geography from my conversations with my US friends, I can't be certain.
Felicitations
Excellent and fascinating work. Thank you!
ReplyDeleteGreat blog post and really helpful and your blog are very interesting.
ReplyDeleteMidnightinfo
GATE 2018
MPPEB Police Constable Answer Key 2017
JKKVIB Junior Supervisor Answer Key 2017
KPSC KAS Answer Key 2017